Timber is one of the oldest materials that humans learned to use
For ancient Estonians, timber was the main material for both construction and the manufacture of goods. The oldest written records of Estonian forestry history date back to 1795, about forest management in Sõrve, but forestry as an industry emerged at the end of the eighteenth century. The first forest districts in Livonia for managing the forest were established in 1827.
Forest management is regulated by the Forest Act, more detailed rules for forest management are established in the forest management guidelines and the forest management rules. The state forest is managed by the State Forest Management Centre (RMK) The State Forest Management Centre oversees 47% of Estonian forests. Forest resources are managed in the forest register. For felling, you need submit a forest notification to the state.
The data in the forest register does not include the entire forest land. In order to obtain a comprehensive and up-to-date overview of Estonian forest resources, a statistical forest inventory was launched in 1999. The statistical forest inventory is a sample survey that provides operational and economic information on forests. The method allows to objectively monitor the dynamics of forest processes in the country as a whole. The main task of the statistical forest inventory is to describe forests and their changes and to provide an overview of felling. In addition to the information collected on forests, data can be recorded on, for example, land utilisation, biodiversity, non-forest timber stocks, and afforestation. The statistical forest inventory is a sample survey, which is why in this statistical survey, the estimation of a characteristic of a population based on the characteristics of the plots is always accompanied by an error due to probabilistic selection. Thus, the actual value of the indicators in the tables may be higher or lower by the margin of the reported error, or confidence level.
The forest composition:
| Forest land area by dominant tree species in 2003-2022 (1000 ha) | ||||||||
| Year | Pine | Spruce | Birch | Aspen | Black alder | Grey alder | Others | Total |
| 2022 | 705 | 426 | 686 | 150 | 95 | 227 | 36 | 2325 |
| 2021 | 709 | 431 | 686 | 149 | 95 | 219 | 35 | 2326 |
| 2020 | 711 | 439 | 684 | 151 | 95 | 210 | 35 | 2325 |
| 2019 | 725 | 440 | 683 | 149 | 91 | 209 | 36 | 2333 |
| 2018 | 729 | 439 | 683 | 146 | 88 | 208 | 37 | 2331 |
| 2017 | 732 | 438 | 687 | 144 | 87 | 205 | 39 | 2331 |
| 2016 | 736 | 429 | 682 | 138 | 83 | 208 | 38 | 2313 |
| 2015 | 739 | 419 | 692 | 134 | 78 | 210 | 37 | 2310 |
| 2014 | 744 | 410 | 690 | 131 | 75 | 208 | 38 | 2295 |
| 2013 | 733 | 388 | 697 | 129 | 78 | 205 | 38 | 2268 |
| 2012 | 722 | 385 | 702 | 129 | 78 | 196 | 37 | 2250 |
| 2011 | 726 | 385 | 701 | 1230 | 74 | 184 | 35 | 2235 |
| 2010 | 744 | 377 | 681 | 124 | 72 | 187 | 37 | 2222 |
| 2009 | 751 | 376 | 678 | 121 | 70 | 185 | 36 | 2217 |
| 2008 | 759 | 389 | 671 | 121 | 69 | 184 | 37 | 2229 |
| 2007 | 770 | 388 | 681 | 121 | 69 | 196 | 40 | 2265 |
| 2006 | 747 | 395 | 688 | 125 | 66 | 208 | 40 | 2269 |
| 2005 | 730 | 402 | 703 | 124 | 68 | 207 | 36 | 2271 |
| 2004 | 740 | 407 | 700 | 127 | 69 | 202 | 37 | 2282 |
| 2003 | 718 | 405 | 701 | 128 | 66 | 201 | 37 | 2255 |
Over the last 20 years, both the area and reserves of forests have increased. The amount of coniferous and deciduous forests is equal in Estonia. In the area distribution by the majority tree species, we have the most pine forests (30%), birch forests (30%), and spruce forests (18%). However, when you look at the distribution of tree species, pine is still in first place (29%), followed by spruce (26%) and birch (23%), meaning that spruce is often a cohabiting tree species in different stands.
| Forest land growing stock by dominant tree species in 2002-2022 (1000 m3) | ||||||||
| Year | Pine | Spruce | Birch | Aspen | Black alder | Grey alder | Others | Total |
| 2022 | 160 779 | 85 882 | 119 387 | 34 087 | 18 671 | 31 739 | 6 137 | 456 683 |
| 2021 | 164 069 | 88 787 | 120 064 | 34 208 | 18 731 | 31 795 | 6 203 | 463 857 |
| 2020 | 166 666 | 92 589 | 121 759 | 35 175 | 18 981 | 31 074 | 6 265 | 472 509 |
| 2019 | 170 919 | 94 241 | 123 866 | 35 041 | 19 192 | 31 825 | 6 529 | 481 612 |
| 2018 | 172 463 | 95 504 | 123 644 | 34 244 | 19 050 | 32 238 | 6 866 | 484 009 |
| 2017 | 175 025 | 96 279 | 125 428 | 34 092 | 19 586 | 32 330 | 7 191 | 489 931 |
| 2016 | 177 014 | 94 581 | 124 869 | 32 867 | 19 091 | 33 011 | 6 900 | 488 333 |
| 2015 | 178 683 | 92 039 | 125 868 | 32 023 | 18 685 | 33 506 | 6 540 | 487 345 |
| 2014 | 178 683 | 91 292 | 124 413 | 31 428 | 17 591 | 33 919 | 6 452 | 483 778 |
| 2013 | 174 786 | 87 123 | 125 965 | 31 822 | 17 860 | 34 535 | 6 565 | 478 656 |
| 2012 | 170 855 | 85 233 | 124 428 | 31 319 | 17 532 | 33 535 | 6 406 | 469 308 |
| 2011 | 169 050 | 84 179 | 122 255 | 31 593 | 16 775 | 31 519 | 6 056 | 461 426 |
| 2010 | 169 031 | 82 272 | 116 154 | 30 469 | 15 627 | 32 127 | 6 319 | 452 000 |
| 2009 | 168 733 | 80 400 | 113 147 | 30 198 | 15 547 | 31 371 | 6 245 | 445 640 |
| 2008 | 167 690 | 82 122 | 109 686 | 29 742 | 15 286 | 31 366 | 5 852 | 441 745 |
| 2007 | 165 432 | 82 431 | 110 128 | 29 358 | 14 837 | 33 425 | 6 284 | 441 893 |
| 2006 | 158 132 | 84 311 | 110 857 | 29 728 | 13 947 | 35 421 | 6 317 | 438 714 |
| 2005 | 151 200 | 85 042 | 113 165 | 30 017 | 14 672 | 34 907 | 5 978 | 434 981 |
| 2004 | 151 385 | 86 162 | 113 163 | 30 279 | 14 878 | 34 184 | 6 075 | 436 126 |
| 2003 | 143 928 | 85 039 | 113 164 | 31 137 | 14 424 | 34 194 | 6 475 | 428 360 |
However, the composition of the managed forest land is important in terms of the timber resources used. Here, two opposing processes have taken place simultaneously. Firstly, the area of managed forest land has been constantly increasing due to the afforestation of shrubs and unused agricultural land, but at the same time, new forests have also been placed under strict protection. For example, where in 2016, there were 271,300 ha under strict protection, then in 2022, there were already 21,663 ha.
| Distribution of managed forest land area by dominant tree species (1000 ha) | ||||||||
| Year | Pine | Spruce | Birch | Aspen | Black alder | Grey alder | Others | Total |
| 2022 | 512 | 360 | 585 | 126 | 76 | 215 | 30 | 1 903 |
| 2020 | 526 | 370 | 585 | 131 | 77 | 200 | 31 | 1 920 |
| 2015 | 603 | 378 | 617 | 121 | 65 | 205 | 32 | 2 022 |
| 2010 | 633 | 356 | 623 | 115 | 64 | 184 | 35 | 2 010 |
| 2005 | 613 | 376 | 647 | 119 | 60 | 202 | 33 | 2 050 |
| Distribution of managed forest land growing stock by dominant tree species (1000 m3) | ||||||||
| Year | Pine | Spruce | Birch | Aspen | Black alder | Grey alder | Others | Total |
| 2022 | 115 230 | 67 507 | 97 384 | 25 002 | 13 296 | 29 303 | 4707 | 352 430 |
| 2020 | 123 575 | 73 540 | 100 634 | 27 655 | 13968 | 29 098 | 5 174 | 373 643 |
| 2015 | 147 741 | 81 198 | 109 513 | 27 224 | 14 840 | 32 454 | 5 395 | 418 364 |
| 2010 | 146 760 | 76 965 | 104 267 | 27 093 | 13 748 | 31 414 | 5 792 | 406 040 |
| 2005 | 129 569 | 79 157 | 103 762 | 28 267 | 12 860 | 33 764 | 5 120 | 392 500 |
Felling
The volume of prescribed cut has lessened and grown nearly three times over the last 20 years. The peaks of the time series have been in 2017 and 2018, the lowest felling volume occurred in 2008. As to what kind of forests we cut down, it is easy to remember that 1/3 of clearcutting is done in birch forests, 1/4 of clearcutting in pine forests, and 1/5 of clearcutting in spruce forests.
| Fellings by felling types in 2000-2021 (1000 m3) | ||||||||
| Year | Maintenance felling | Incl dead trees | Regeneration felling | Incl dead trees | Other types of fellings | Incl dead trees | Total fellings | Incl dead trees |
| 2021 | 1 665 | 403 | 8 062 | 356 | 248 | 4 | 9 975 | 763 |
| 2020 | 1 883 | 260 | 8 599 | 376 | 199 | 1 | 10 681 | 636 |
| 2019 | 1 833 | 190 | 9 150 | 378 | 274 | 6 | 11 257 | 574 |
| 2018 | 1 925 | 252 | 10 627 | 513 | 254 | 9 | 12 807 | 774 |
| 2017 | 1 665 | 311 | 10 618 | 464 | 315 | 31 | 12 598 | 807 |
| 2016 | 1 610 | 357 | 9 023 | 382 | 161 | 26 | 10 793 | 765 |
| 2015 | 1 671 | 258 | 8 239 | 241 | 192 | 23 | 10 102 | 521 |
| 2014 | 1 656 | 293 | 8 078 | 363 | 311 | 1 | 10 045 | 658 |
| 2013 | 2 017 | 351 | 7 667 | 423 | 423 | 2 | 10 108 | 776 |
| 2012 | 1 729 | 453 | 7 912 | 450 | 556 | 10 | 10 197 | 913 |
| 2011 | 1 816 | 378 | 6 774 | 427 | 414 | 12 | 9 003 | 817 |
| 2010 | 1 483 | 289 | 6 356 | 359 | 342 | 19 | 8 181 | 667 |
| 2009 | 1 406 | 240 | 4 732 | 324 | 223 | 10 | 6 362 | 575 |
| 2008 | 1 171 | 197 | 4 144 | 148 | 133 | 9 | 5 448 | 353 |
| 2007 | 1 335 | 292 | 4 203 | 183 | 437 | 12 | 5 975 | 488 |
| 2006 | 1 746 | 392 | 4 285 | 196 | 516 | 13 | 6 548 | 601 |
| 2005 | 2 461 | 473 | 4 967 | 406 | 550 | 13 | 7 978 | 892 |
| 2004 | 2 775 | 355 | 5 143 | 336 | 199 | 4 | 8 118 | 695 |
| 2003 | 3 350 | 301 | 6 313 | 287 | 191 | 4 | 9 854 | 592 |
| 2002 | 3 193 | 188 | 6 659 | 188 | 302 | 7 | 10 153 | 383 |
| Felling area in 2002-2021 (1000 ha) | |||||||
| Year | Cleaning | Thinning | Sanitation | Clear felling | Shelterwood felling | Selection felling | Other fellings |
| 2021 | 14,0 | 15,8 | 16,2 | 27,1 | 2,1 | 2,0 | 8,6 |
| 2020 | 8,8 | 19,4 | 15,9 | 29,7 | 4,3 | 1,8 | 8,2 |
| 2019 | 11,0 | 19,5 | 13,9 | 29,7 | 5,2 | 2,4 | 6,5 |
| 2018 | 10,2 | 19,3 | 13,0 | 34,6 | 3,9 | 1,2 | 5,7 |
| 2017 | 12,0 | 14,9 | 11,4 | 35,6 | 3,2 | 1,1 | 4,3 |
| 2016 | 9,7 | 14,6 | 12,2 | 32,4 | 1,8 | 0,8 | 2,4 |
| 2015 | 10,2 | 18,5 | 10,8 | 31,6 | 2,4 | 1,6 | 2,5 |
| 2014 | 8,9 | 18,9 | 11,0 | 29,7 | 2,4 | 2,6 | 2,4 |
| 2013 | 12,0 | 24,8 | 11,7 | 28,7 | 2,2 | 5,0 | 3,7 |
| 2012 | 12,4 | 18,7 | 13,3 | 27,4 | 2,3 | 4,8 | 4,9 |
| 2011 | 12,2 | 22,6 | 12,4 | 25,0 | 2,9 | 5,1 | 5,3 |
| 2010 | 8,4 | 16,3 | 9,8 | 22,8 | 4,0 | 5,9 | 4,1 |
| 2009 | 6,4 | 16,2 | 8,5 | 17,3 | 3,9 | 6,4 | 2,6 |
| 2008 | 5,8 | 12,5 | 6,2 | 12,8 | 4,3 | 6,1 | 4,7 |
| 2007 | 5,2 | 13,4 | 9,5 | 12,7 | 3,3 | 3,5 | 7,4 |
| 2006 | 4,0 | 12,7 | 17,5 | 12,2 | 4,0 | 5,4 | 6,7 |
| 2005 | 2,8 | 19,3 | 17,7 | 15,0 | 4,3 | 4,5 | 4,1 |
| 2004 | 3,0 | 22,0 | 16,6 | 18,3 | 5,9 | 4,9 | 3,0 |
| 2003 | 3,3 | 31,8 | 10,6 | 23,8 | 6,8 | 3,9 | 5,5 |
| 2002 | 3,1 | 30,2 | 10,8 | 26,5 | 5,0 | 4,6 | 5,1 |
Sustainability
From time to time, sustainability becomes an issue. The concept of sustainable forest management (including 45 characteristic indicators) has been agreed during the Ministerial Conference on the Protection of Forests in Europe (https://foresteurope.org/). One of the indicators is the balance between the net growth of managed forests and the volume of felling, which has been specified in the longer explanation: felling must not exceed growth in the long run; in the short and medium term, forestry can be sustainable even when felling exceeds the growth rate.
Net growth is the difference of the stock of live trees (excluding felling). If the stock of managed forests increases, the ratio of net growth to (live tree) felling is > 1. If the reserve decreases, the ratio of net growth to (live tree) felling is < 1. However, the premise of such a simple comparison is that the areas and land categories do not change. However, as previously described, there have been major changes in the areas. In addition to changes in the surface area of forest land, the age distribution must also be taken into account, and also in two aspects. First, the age distribution of the managed forest land. The net growth of very young and old forests is lower than the net growth of middle-aged forest land. Secondly, the age distribution of the land (forest) changing the land category. For example, when area with young forest increases in managed forest (overgrown grassland becomes forest land), the reserve of managed forest land grows relatively little, while when older forests are taken under strict protection, the loss of reserve is higher from the reserve of managed forest land for the same area. Taking all this into account in the short term is possible with a thorough analysis, while in the long term, a simple comparison of hectare stocks is enough. Therefore, we can say that the average volume of felling and the net growth of managed forests in Estonia over the last 16 years has been in the same range.
To understand the content of the indicator, the indicator can be viewed from a long-term perspective. We assume that the area of managed forests will remain the same. If we now cut less than the net growth continuously in the very long run, the net growth and thus the volume of felling will eventually reach zero. However, if the net growth is continuously exceeded, the forest reserve will reach zero. Thus, it is not possible to cut less or more than the net growth indefinitely. Finally, it is important to emphasise that this indicator only assesses the sustainability of timber use (and only in one respect). Sustainable forest management as a whole means much more (see here).
Distribution of forest stands in 2022
| Distribution of forest land by development classes and dominant tree species (1000 ha) | ||||||||
| Development class | Pine | Spruce | Birch | Aspen | Black alder | Grey alder | Others | Total |
| Treeless area | 17,7 | 17,5 | 32,6 | 5,3 | 3,8 | 7,0 | 0,9 | 84,9 |
| Under regeneration | 29,0 | 47,0 | 25,9 | 11,7 | 5,4 | 8,2 | 1,7 | 128,9 |
| Young forest | 35,8 | 46,5 | 89,3 | 37,3 | 17,4 | 63,8 | 3,3 | 293,4 |
| Pole stant | 39,3 | 28,2 | 65,0 | 12,3 | 8,5 | 2,3 | 155,5 | |
| Middle-aged stand | 318,9 | 142,7 | 200,1 | 7,4 | 19,1 | 27,8 | 13,8 | 729,9 |
| Premature stand | 85,2 | 38,0 | 88,0 | 5,6 | 12,4 | 31,3 | 6,1 | 266,4 |
| Mature stand | 179,1 | 106,1 | 185,6 | 70,3 | 28,6 | 88,7 | 7,6 | 666,0 |
| Total | 705,1 | 426,0 | 686,5 | 149,8 | 95,2 | 226,8 | 35,7 | 2325,0 |
According to the development class, 40% of the managed forests are premature or mature. In reality, there are more managed forests that exceed the renewal felling criteria; the statistical forest inventory distribution does not take into account maturity by diameter and the weighted average felling age.
| Distribution of managed forest land area by development classes and dominant tree species (1000 ha) | ||||||||
| Development class | Pine | Spruce | Birch | Aspen | Black alder | Grey alder | Others | Total |
| Treeless area | 16,1 | 15,7 | 31,2 | 5,2 | 3,6 | 7,0 | 0,9 | 79,7 |
| Under regeneration | 25,9 | 46,2 | 23,9 | 10,6 | 5,4 | 7,9 | 1,7 | 121,7 |
| Young forest | 29,9 | 44,0 | 83,5 | 35,1 | 16,3 | 62,8 | 2,9 | 274,5 |
| Pole stand | 30,9 | 25,8 | 57,1 | 11,3 | 7,6 | 2,1 | 135,0 | |
| Middle-aged stand | 247,2 | 123,5 | 177,3 | 7,0 | 15,2 | 26,7 | 10,7 | 607,8 |
| Premature stand | 64,4 | 30,5 | 75,6 | 5,1 | 9,3 | 30,1 | 5,3 | 220,2 |
| Mature stand | 97,9 | 74,4 | 136,3 | 51,2 | 18,5 | 80,3 | 5,8 | 464,4 |
| Total | 512,3 | 360,2 | 585,0 | 125,6 | 76,0 | 214,8 | 29,6 | 1903,4 |
If it is necessary to know the content of development classes to monitor the development class distribution, it is easier to monitor the age class distribution. An interesting trend is the constant increase in the area of older forests; the area of stands both over 80 and over 100 years old has increased. Given the increase in the area of strictly protected forests, this trend is expected for the whole forest, but it is less known that there has been a similar trend for managed forests.
| Distribution of stands by age classes and dominant tree species (10 years age classes, 1000 ha) | ||||||||
| Age class | Pine | Spruce | Birch | Aspen | Black alder | Grey alder | Others | Total |
| ...10 | 15,5 | 24,5 | 62,8 | 30,4 | 15,8 | 53,4 | 2,4 | 204,7 |
| 11...20 | 25,0 | 39,1 | 60,7 | 19,3 | 8,8 | 50,2 | 4,8 | 207,9 |
| 21...30 | 30,0 | 35,4 | 79,6 | 11,7 | 6,5 | 35,9 | 6,2 | 205,4 |
| 31...40 | 34,3 | 45,4 | 71,5 | 5,7 | 8,2 | 33,3 | 3,2 | 201,6 |
| 41...50 | 45,3 | 55,4 | 78,1 | 7,9 | 11,6 | 18,8 | 2,4 | 219,5 |
| 51...60 | 66,7 | 39,8 | 90,7 | 18,1 | 12,6 | 15,0 | 1,9 | 244,6 |
| 61...70 | 84,9 | 32,5 | 84,5 | 17,2 | 9,1 | 4,6 | 2,0 | 234,9 |
| 71...80 | 93,9 | 33,0 | 56,6 | 12,2 | 6,2 | 0,3 | 2,3 | 204,5 |
| 81...90 | 78,4 | 19,8 | 27,1 | 5,1 | 4,2 | 0,0 | 1,7 | 136,4 |
| 91...100 | 58,0 | 12,3 | 10,6 | 2,9 | 1,6 | 0,2 | 1,9 | 87,4 |
| 101...110 | 33,1 | 8,0 | 4,3 | 1,6 | 0,8 | 1,9 | 49,6 | |
| 111...120 | 29,2 | 7,3 | 1,1 | 0,8 | 0,4 | 1,6 | 40,4 | |
| 121...130 | 18,0 | 3,2 | 0,3 | 0,2 | 0,5 | 22,2 | ||
| 131...140 | 16,0 | 3,5 | 0,2 | 19,7 | ||||
| 141... | 30,0 | 2,3 | 0,3 | 32,6 | ||||
| Total | 658,3 | 361,5 | 627,9 | 132,8 | 86,0 | 211,6 | 33,1 | 2111,3 |
| Distribution of stands in managed forests by age classes and dominant tree species (10 years age classes, 1000 ha) | ||||||||
| Age class | Pine | Spruce | Birch | Aspen | Black alder | Grey alder | Others | Total |
| ...10 | 15,0 | 23,4 | 60,1 | 28,5 | 14,8 | 52,3 | 2,2 | 196,4 |
| 11...20 | 23,4 | 36,9 | 57,1 | 17,9 | 8,0 | 48,7 | 4,6 | 196,6 |
| 21...30 | 26,7 | 31,9 | 71,5 | 11,1 | 6,0 | 33,5 | 5,7 | 186,5 |
| 31...40 | 28,0 | 39,3 | 61,5 | 5,2 | 6,3 | 30,5 | 3,1 | 173,8 |
| 41...50 | 35,2 | 46,8 | 67,6 | 6,8 | 8,6 | 16,9 | 2,2 | 184,1 |
| 51...60 | 51,6 | 32,1 | 77,3 | 14,8 | 9,1 | 13,6 | 1,4 | 199,8 |
| 61...70 | 65,7 | 26,9 | 68,3 | 11,7 | 5,6 | 3,9 | 1,4 | 183,6 |
| 71...80 | 69,9 | 26,4 | 41,3 | 7,4 | 4,9 | 0,3 | 1,1 | 151,3 |
| 81...90 | 57,7 | 14,8 | 16,7 | 3,6 | 2,3 | 0,0 | 0,8 | 95,9 |
| 91...100 | 38,1 | 8,7 | 6,3 | 1,4 | 0,9 | 0,2 | 1,4 | 57,1 |
| 101...110 | 19,4 | 4,9 | 1,9 | 0,8 | 0,2 | 0,9 | 28,0 | |
| 111...120 | 15,6 | 3,8 | 0,2 | 0,5 | 0,0 | 1,4 | 21,4 | |
| 121...130 | 8,0 | 1,1 | 0,0 | 0,0 | 0,3 | 9,4 | ||
| 131...140 | 6,8 | 1,1 | 0,2 | 8,0 | ||||
| 141... | 9,4 | 0,3 | 0,3 | 10,0 | ||||
| Total | 470,2 | 298,3 | 529,9 | 109,8 | 67,0 | 199,9 | 26,9 | 1702,0 |
Uses of wood
After Estonia regained its independence, the forest and timber industry has been one of the fastest growing and largest industries in terms of exports, accounting for one fifth of all manufacturing exports. In 2021, companies in the forest and timber sector (forestry, mechanical and chemical processing of wood, and furniture production) accounted for 3% of active companies in Estonia. Employees employed by the sector accounted for 6.3% of all employees. The forest and timber sector directly employs just over 30,000 people and, taking into account indirect and spill-over effects, creates almost 58,209 jobs. As a significant proportion of the jobs in the timber sector are located outside the centres, the sector plays an important role in rural development.
A more detailed overview of the use of timber is provided in the timber balance. The timber used from the forest is divided into different assortments. In the timber balance, sorting is performed based on the actual primary use of the timber, i.e. a log is the raw material for sawn timber, veneer, and plywood, paper wood is raw material for cellulose, pulp, and boards, and firewood is an input for energy or energy products.
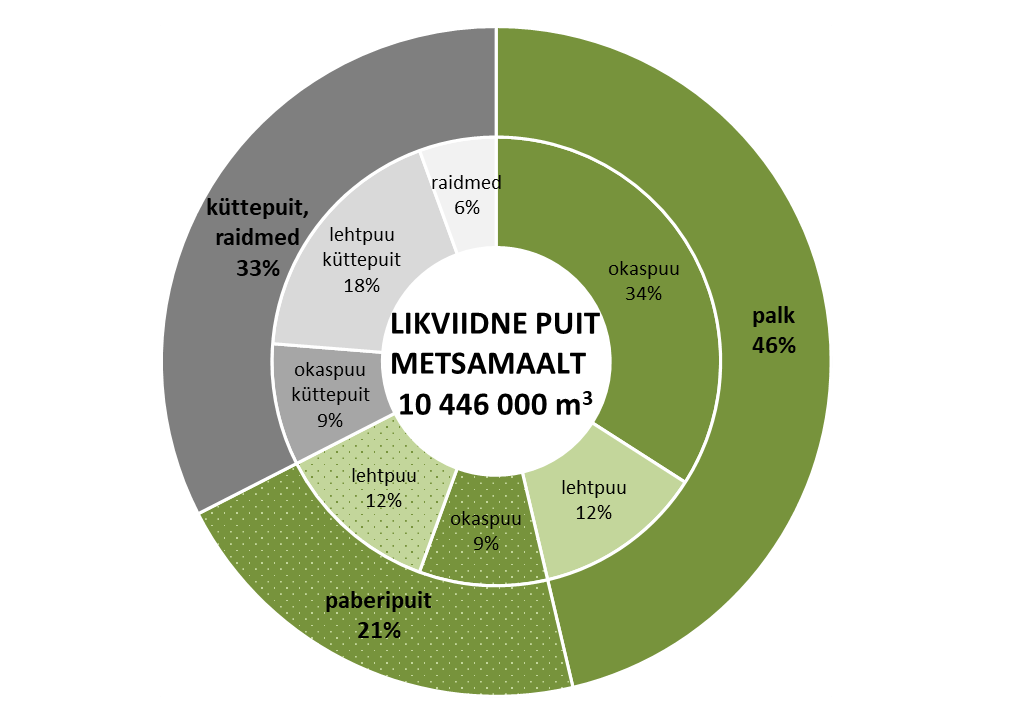
The volume of marketed wood from forest land by assortments in 2020:
(Küttepuit ja raidmed – firewood and logging waste; okaspuu palk – conifer logs; lehtpuu palk – hardwood logs; okaspuu paberipuit – conifer pulpwood; lehtpuu paberipuit – hardwood pulpwood)
Text: Madis Raudsaar
Editor: Madis Raudsaar, Feliks Sirkas
Last modified: 08.08.2023
_________________________________________
Kasutatud allikad:
- Eesti statistiline metsainventuur (SMI). Keskkonnaagentuur.
- Metsaajaloo tundmine aitab ka nüüdismetsandust edasi
- Sirkas, F. 2024. Puidubilanss. Ülevaade Eesti puidukasutuse mahust 2022. aastal. Keskkonnaagentuur, Tallinn.
- Ernst & Young Baltic AS. 2024. Metsa- ja puidusektori sotsiaalmajandusliku mõju analüüs. Tallinn.